Using an off the shelf energy monitor you can graph your energy using Cacti. The monitor unit I’ve used here is a Current Cost ENVI. E-On were giving these away for free but they’ve probably stopped that now.

It comprises of a sender unit, with a single phase clamp sensor and an LCD display receiver unit. The receiver unit comes complete with a handy RJ11 serial port connection.
Using an RJ11 to RS232 cable, or better still a USB to serial converter, you can read the XML which the units spurts out. This is designed to be used with their own software but where’s the fun in that? Better still this method allows you to use a low power device to do the monitoring instead of the irony of using a power hungry tower computer to monitor how much juice it’s taking to monitor your energy usage.
The sender unit has four sensor inputs but I just used one – clamped onto the positive feed into the house. The receiver unit also has a thermometer so in this scenario it outputs two values: current and temperature.
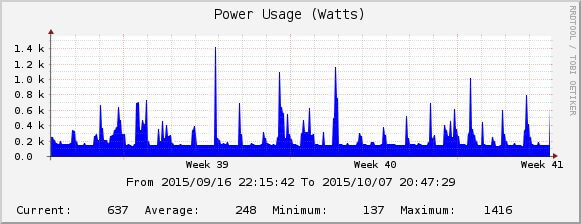
The output from the serial port is XML so we need to strip out the info we need and present that as an integer for Cacti to read. It can output graphs which look like this:
Here’s the perl script I’m using to do this:
#!/usr/bin/perl
# Reads data from a Current Cost device via serial port.

use strict;
use Device::SerialPort qw( :PARAM :STAT 0.07 );
use Fcntl qw(LOCK_EX LOCK_NB);
use File::NFSLock;

my $lock = File::NFSLock->new($0, LOCK_EX|LOCK_NB);
die "$0 is already running!\n" unless $lock;

my $PORT = "/dev/ttyUSB0";

my $ob = Device::SerialPort->new($PORT);
$ob->baudrate(57600);
$ob->write_settings;

open(SERIAL, "+>$PORT");
while (my $line = <SERIAL>) {

#print $line;
if ($line =~ m!<tmpr>\s*(-*[\d.]+)</tmpr>.*<ch1><watts>0*(\d+)</watts></ch1>!)
{
 my $temp = $1;
 my $ch1 = $2;
 my $ch2 = $3;
 my $ch3 = $4;
 my $total = $2+$3+$4;
 print "$1 Degrees\n";
 #print "Channel 1 : $2 watts\n";
 print "$2 Watts\n";

 open(my $fh, '>', '/var/www/html/currentcost/power.html');
 print $fh "$2";
 close $fh;
 open(my $fh, '>', '/var/www/html/currentcost/temp.html');
 print $fh "$1";
 close $fh;
 last;
 }
}
Because I’m using a Serial->USB adapter the device I need is /dev/ttyUSB0, if you are using a built in serial port it might be /dev/ttyS0. The baud rate for this device is 57600 which is already set in the script. The output is written to /tmp/currentcost, which Cacti can then read from. The unit sends data every few seconds so it may take a moment to return a value. The value will write to the file as a single integer, such as ‘352’, the unit being watts.
I’m not too interested in the temperature so it only outputs sensor 1 but the script is easy to tweak if required.
You can make this script continue the while loop by removing ‘last;’ but I want it to run once. I cron the script to run once every 5 minutes. This needs to be run as root or via sudo or suid bit etc as only root can set the baud rate.
Configuring Cacti is well documented so well out of scope here, instead here’s the link to their doc page on this topic. The Input Type should be ‘Script/Command’ and set to ‘/usr/bin/cat /tmp/currentcost’.
That’s all folks – have fun!